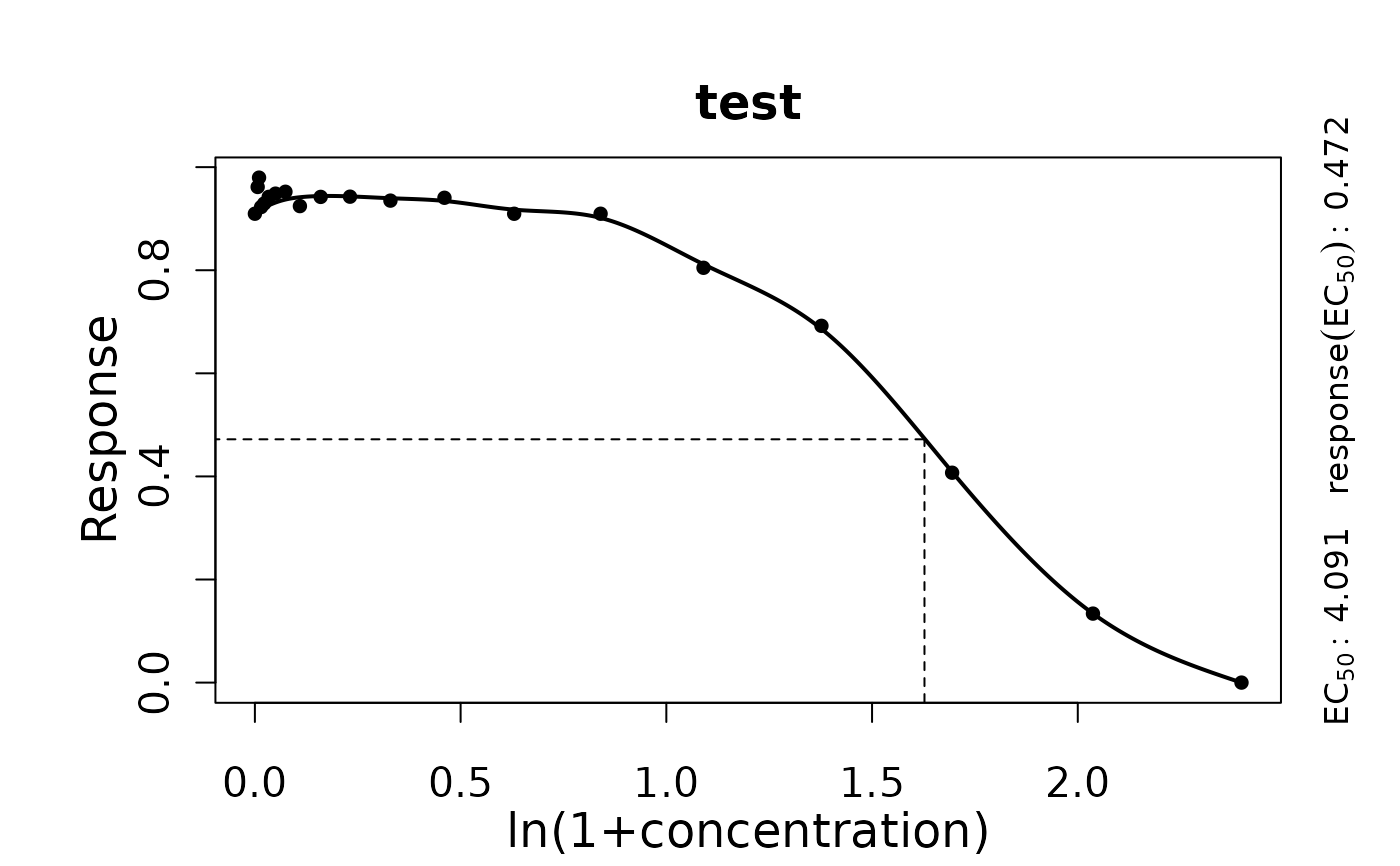
codeplot.drFitSpline generates the spline fit plot for response-parameter vs. concentration data
Usage
# S3 method for drFitSpline
plot(
  x,
  add = FALSE,
  ec50line = TRUE,
  log = "",
  pch = 16,
  colSpline = 1,
  colData = 1,
  cex.point = 1,
  cex.lab = 1.5,
  cex.axis = 1.3,
  y.lim = NULL,
  x.lim = NULL,
  y.title = NULL,
  x.title = NULL,
  lwd = 2,
  plot = TRUE,
  export = FALSE,
  height = 7,
  width = 9,
  out.dir = NULL,
  ...
)
Arguments
- x
object of class
drFitSpline, created withgrowth.drFitSpline.- add
(Logical) Shall the fitted spline be added to an existing plot?
TRUEis used internally byplot.drBootSpline.- ec50line
(Logical) Show pointed horizontal and vertical lines at the EC50 value (
TRUE) or not (FALSE).- log
("x", "y", or "xy") Display the x- or y-axis on a logarithmic scale.
- pch
(Numeric) Shape of the raw data symbols.
- colSpline
(Numeric or character) Spline line colour.
- colData
(Numeric or character) Contour color of the raw data circles.
- cex.point
(Numeric) Size of the raw data symbols.
- cex.lab
(Numeric) Font size of axis titles.
- cex.axis
(Numeric) Font size of axis annotations.
- y.lim
(Numeric vector with two elements) Optional: Provide the lower (
l) and upper (u) bounds on the y-axis as a vector in the formc(l, u). If only the lower or upper bound should be fixed, providec(l, NA)orc(NA, u), respectively.- x.lim
(Numeric vector with two elements) Optional: Provide the lower (
l) and upper (u) bounds on the x-axis as a vector in the formc(l, u). If only the lower or upper bound should be fixed, providec(l, NA)orc(NA, u), respectively.- y.title
(Character) Optional: Provide a title for the y-axis.
- x.title
(Character) Optional: Provide a title for the x-axis.
- lwd
(Numeric) Line width of spline.
- plot
(Logical) Show the generated plot in the
Plotspane (TRUE) or not (FALSE).- export
(Logical) Export the generated plot as PDF and PNG files (
TRUE) or not (FALSE).- height
(Numeric) Height of the exported image in inches.
- width
(Numeric) Width of the exported image in inches.
- out.dir
(Character) Name or path to a folder in which the exported files are stored. If
NULL, a "Plots" folder is created in the current working directory to store the files in.- ...
Further arguments to refine the generated base R plot.
Examples
conc <- c(0, rev(unlist(lapply(1:18, function(x) 10*(2/3)^x))),10)
response <- c(1/(1+exp(-0.7*(4-conc[-20])))+stats::rnorm(19)/50, 0)

TestRun <- growth.drFitSpline(conc, response, drID = "test",
                     control = growth.control(log.x.dr = TRUE, smooth.dr = 0.8))
#>
#>
#> === Dose response curve estimation ================
#> --- EC 50 -----------------------------------------
#> --> test
#> xEC50 1.62740039535265 yEC50 0.472023372440819
#> --> Original scale
#> xEC50 4.09062389301508 yEC50 0.472023372440819
#>
#>

print(summary(TestRun))
#>     EC50     yEC50 EC50.orig yEC50.orig test
#> 1 1.6274 0.4720234  4.090624  0.4720234   NA
plot(TestRun)
