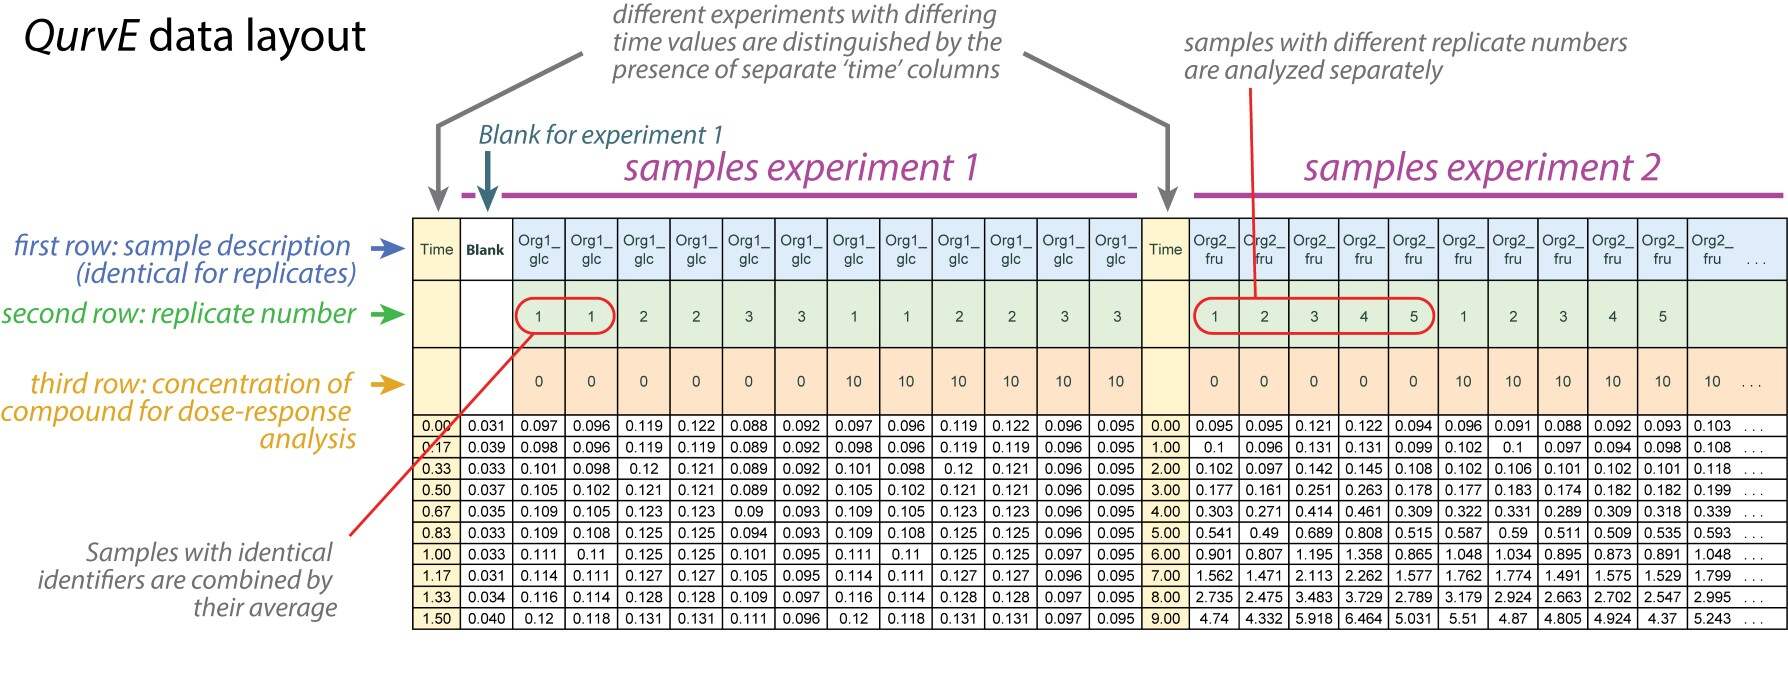
read_data reads table files or R dataframe objects containing growth and fluorescence data and extracts datasets, sample and group information, performs blank correction, applies data transformation (calibration), and combines technical replicates.
Usage
read_data(
  data.growth = NA,
  data.fl = NA,
  data.fl2 = NA,
  data.format = "col",
  csvsep = ";",
  dec = ".",
  csvsep.fl = ";",
  dec.fl = ".",
  csvsep.fl2 = ";",
  dec.fl2 = ".",
  sheet.growth = 1,
  sheet.fl = 1,
  sheet.fl2 = 1,
  fl.normtype = c("growth", "fl2"),
  subtract.blank = TRUE,
  convert.time = NULL,
  calib.growth = NULL,
  calib.fl = NULL,
  calib.fl2 = NULL
)
Arguments
- data.growth
An R dataframe object or a table file with extension '.xlsx', '.xls', '.csv', '.tsv', or '.txt' containing growth data. The data must be either in the '
QurvEcustom layout' or in 'tidy' (long) format. The first three table rows in the 'customQurvElayout' contain:Sample description
Replicate number (optional: followed by a letter to indicate technical replicates)
Concentration value (optional)
Data in 'tidy' format requires the following column headers:
"Time": time values
"Description": sample description
"Replicate": replicate number (optional)
"Concentration": concentration value (optional)
"Values": growth values (e.g., optical density)
- data.fl
(optional) An R dataframe object or a table file with extension '.xlsx', '.xls', '.csv', '.tsv', or '.txt' containing fluorescence data. Table layout must mimic that of
data.growth.- data.fl2
(optional) An R dataframe object or a table file with extension '.xlsx', '.xls', '.csv', '.tsv', or '.txt' containing measurements from a second fluorescence channel (used only to normalize
fluorescencedata). Table layout must mimic that ofdata.growth.- data.format
(Character) "col" for samples in columns, or "row" for samples in rows. Default:
"col"- csvsep
(Character) separator used in CSV file storing growth data (ignored for other file types). Default:
";"- dec
(Character) decimal separator used in CSV, TSV or TXT file storing growth data. Default:
"."- csvsep.fl, csvsep.fl2
(Character) separator used in CSV file storing fluorescence data (ignored for other file types). Default:
";"- dec.fl, dec.fl2
(Character) decimal separator used in CSV, TSV or TXT file storing fluorescence data. Default:
"."- sheet.growth, sheet.fl, sheet.fl2
(Numeric or Character) Number or name of the sheet with the respective data type in XLS or XLSX files (optional).
- fl.normtype
(Character string) Normalize fluorescence values by either diving by
'growth'or by fluorescence2 values ('fl2').- subtract.blank
(Logical) Shall blank values be subtracted from values within the same experiment (TRUE, the default) or not (FALSE).
- convert.time
(
NULLor string) Convert time values with a formula provided in the form'y = function(x)'. For example:convert.time = 'y = 24 * x'- calib.growth, calib.fl, calib.fl2
(Character or
NULL) Provide an equation in the form 'y = function(x)' (for example: 'y = x^2 * 0.3 - 0.5') to convert growth and fluorescence values. This can be used to, e.g., convert plate reader absorbance values into OD600 or fluorescence intensity into molecule concentrations. Caution!: When utilizing calibration, carefully consider whether or not blanks were subtracted to determine the calibration before selecting the inputsubtract.blank = TRUE.
Value
An R list object of class grodata containing a time matrix, dataframes with growth and fluorescence data (if applicable),
and an experimental design table. The grodata object can be directly
used to run growth.workflow/fl.workflow or, together with a growth.control/fl.control
object, in growth.gcFit/flFit.
- time
Matrix with raw time values extracted from
data.growth.- growth
Dataframe with raw growth values and sample identifiers extracted from
data.growth.- fluorescence
Dataframe with raw fluorescence values and sample identifiers extracted from
data.fl.NA, if no fluorescence data is provided.- norm.fluorescence
fluorescence data divided by growth values.
NA, if no fluorescence data is provided.- expdesign
Experimental design table created from the first three identifier rows/columns (see argument
data.format) (data.growth.
Examples
# Load CSV file containing only growth data
data_growth <- read_data(data.growth = system.file("2-FMA_toxicity.csv",
                         package = "QurvE"), csvsep = ";" )
#> Sample data are stored in columns. If they are stored in row format, please run read_data() with data.format = 'row'.

# Load XLSX file containing both growth and fluorescence data
data_growth_fl <- read_data(data.growth = system.file("lac_promoters.xlsx", package = "QurvE"),
                            sheet.growth = "OD",
                            data.fl = system.file("lac_promoters.xlsx", package = "QurvE"),
                            sheet.fl = 2)
#> Sample data are stored in columns. If they are stored in row format, please run read_data() with data.format = 'row'.
